
Visit Analytics
Traffic & Visit Analytics shows how your guest traffic moves over time: which days and hours are busy, how many unique visitors arrive, and how many of them return. It is the page you use for staff planning and for choosing when to send campaigns.
How do I open this screen? From the left menu, go to Analytics and Reports → Visit Analytics.
Note: this screen's labels are still shown in Turkish; the on-screen text is given in brackets.
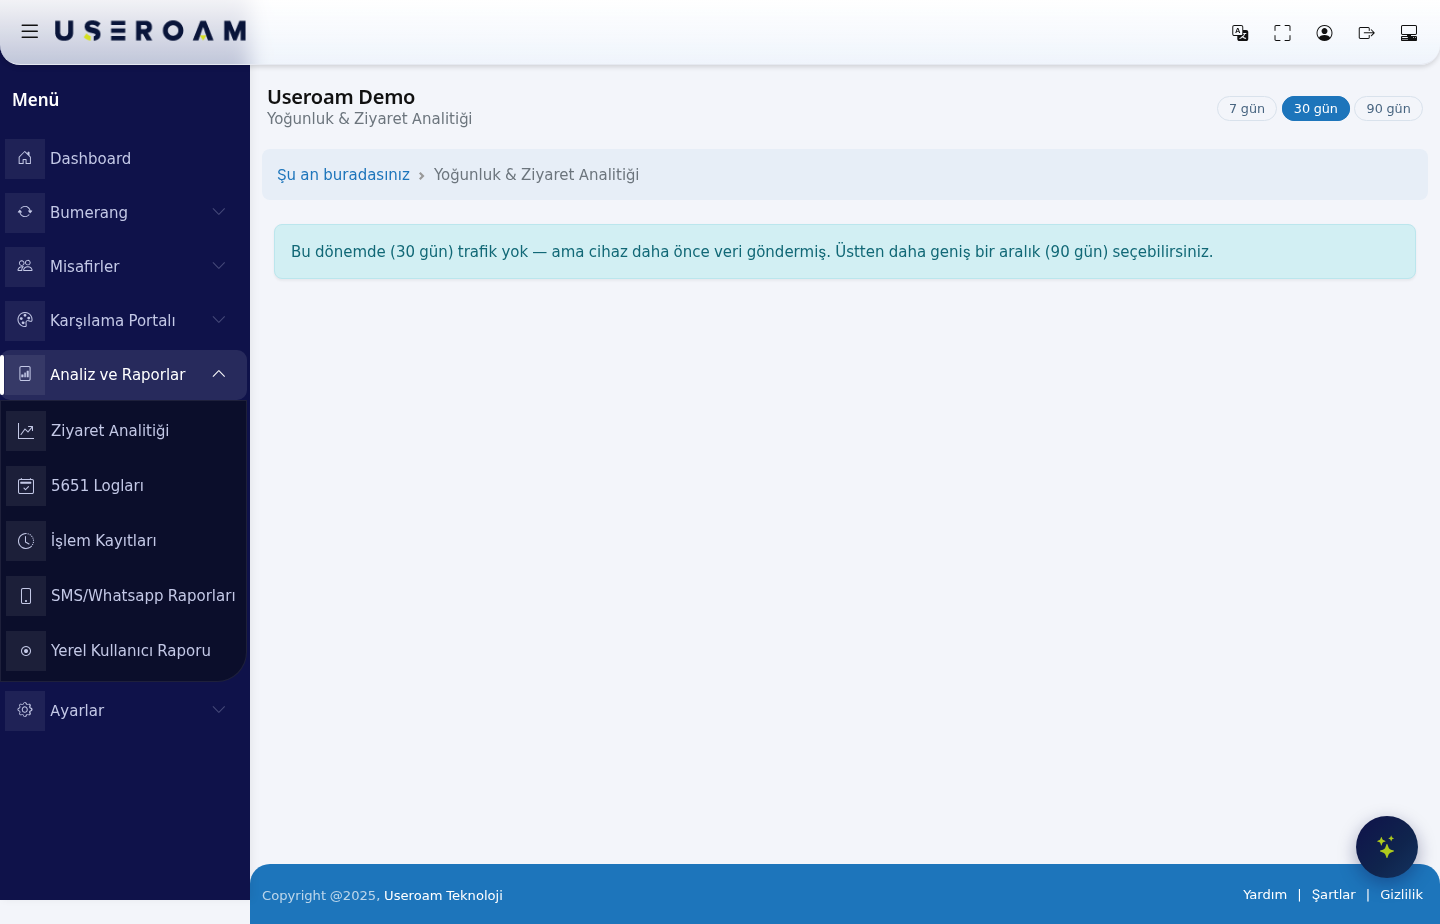
Choosing the period
- 7 days: to see the weekly rhythm — which day is busy, how different the weekend is.
- 30 days: for the general trend and the effect of campaigns.
- 90 days: to see seasonal movement and longer-term growth.
What you see when there is no data
If there was no traffic in the selected period, the page says so explicitly:
"There was no traffic in this period (30 days) — but the device has sent data before. You can select a wider range (90 days) above."
This message lets you tell two situations apart: the device has never sent data (an installation or log-flow problem) versus the device has sent data but there was no traffic in this period (a genuinely quiet stretch). In the second case, simply widen the range.
The analyses on this page
- Visit trend: the daily movement of unique visitors and sessions in the selected period.
- New / returning guests: how much of your traffic is first-time versus returning — the most direct measure of your loyalty work.
- Hour × day heatmap: a heat map crossing days of the week with hours, showing your busiest slot.
How to use it: find your busiest slot and schedule campaign sends one to two hours before it. You can fill the quiet hours with off-peak offers.
Related pages: Dashboard (summary figures), Bumerang → Summary, Bumerang → Guest 360°.