
Bumerang Reports
Bumerang Reports is where all your marketing data comes together: filter it, view it, download it. There are twelve ready-made report tabs — one for every question, from campaign performance to guest lifetime value.
How do I open this screen? From the left menu, go to Bumerang → ANALYTICS → Reports.
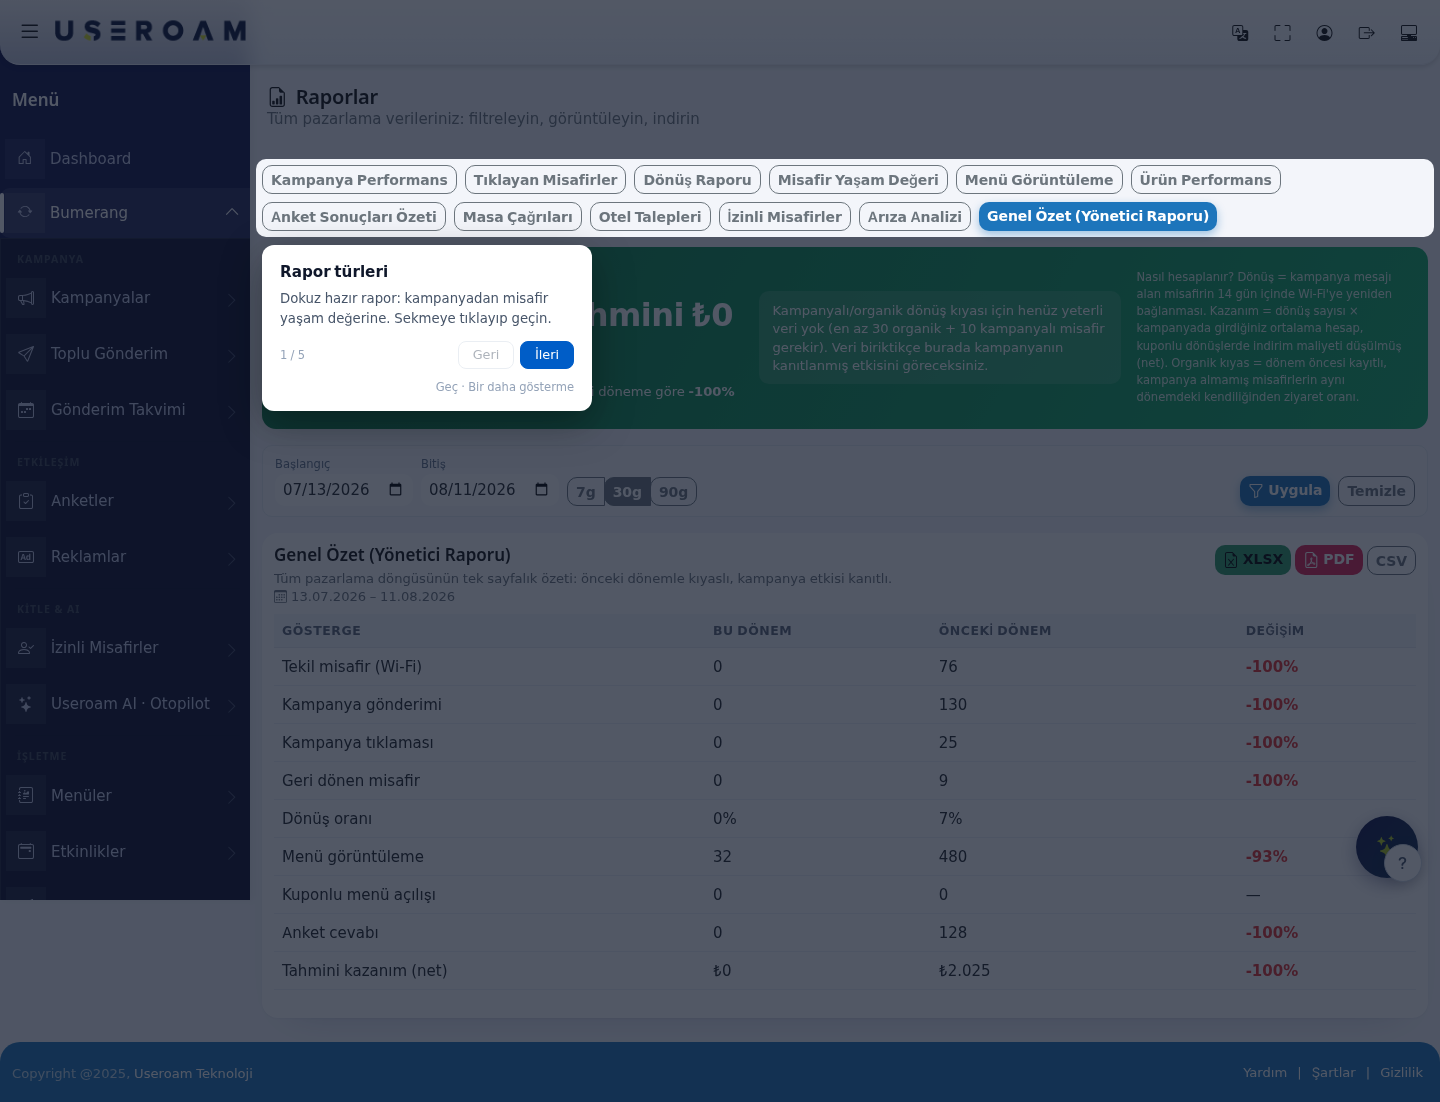
1. Report tabs
- Campaign Performance — sends, clicks and returns per campaign.
- Guests Who Clicked — those who clicked a campaign link.
- Return Report — guests who came back after a campaign.
- Guest Lifetime Value — total value per guest.
- Menu Views and Product Performance — digital menu statistics.
- Survey Results Summary — survey scores and responses.
- Table Calls — restaurant/table call records.
- Hotel Requests — a breakdown of hotel module requests.
- Opted-in Guests — the marketing-consent pool.
- Fault Analysis — the distribution of fault requests.
- General Summary (Manager Report) — the whole cycle on one page.
2. Filters
Start / End dates, or the 7d / 30d / 90d shortcuts. Apply runs the filter; Clear resets it.
3. General Summary (Manager Report)
This tab shows the period compared against the previous one. The table has four columns: METRIC, THIS PERIOD, PREVIOUS PERIOD, CHANGE.
The metrics measured are: unique guests (Wi-Fi), campaign sends, campaign clicks, returning guests, return rate, menu views, coupon-driven menu opens, survey responses, and estimated net revenue.
4. How it is calculated
The definitions stated on screen:
- Return: a guest who received a campaign message reconnecting to Wi-Fi within 14 days.
- Revenue: returns × the average spend you entered on the campaign, net of the discount cost on coupon-driven returns.
- Organic comparison: the spontaneous visit rate, over the same period, of guests registered before the period who received no campaign.
5. Export
Every report can be downloaded as XLSX, PDF or CSV. Reports that may contain personal data carry a data-protection warning on screen.
Related pages: Bumerang → Summary, Campaigns, Opted-in Guests, Guest 360°.