
Bumerang Reports
What is it for?
The Reports screen brings all of your venue's marketing data together in one place: campaigns, returning guests, menu, surveys, table calls, hotel requests and the consented guest pool. You pick a date range, see the table on screen and download it as XLSX, PDF or CSV.
When do you use it?
- At the end of the month, when your boss or partner asks "what did Bumerang bring in this month?" (Executive Summary).
- When you want to see which campaign actually brought guests back (Campaign Performance, Return Report).
- When you want to know which menu item is never opened, or which table calls the waiter most.
- When you want to check whether the same hotel room keeps having faults (Fault Analysis).
Before you start
- The screen shows the data of the device (venue) selected in the panel. If you have several venues, select the right device first.
- Campaign reports only fill up after at least one campaign has run. The menu, table and hotel tabs fill up when those modules are set up.
Step by step: open and download a report
- In the left menu, under Bumerang, open the ANALYTICS heading and click Reports. The screen first opens on the Executive Summary tab with the last 30 days.
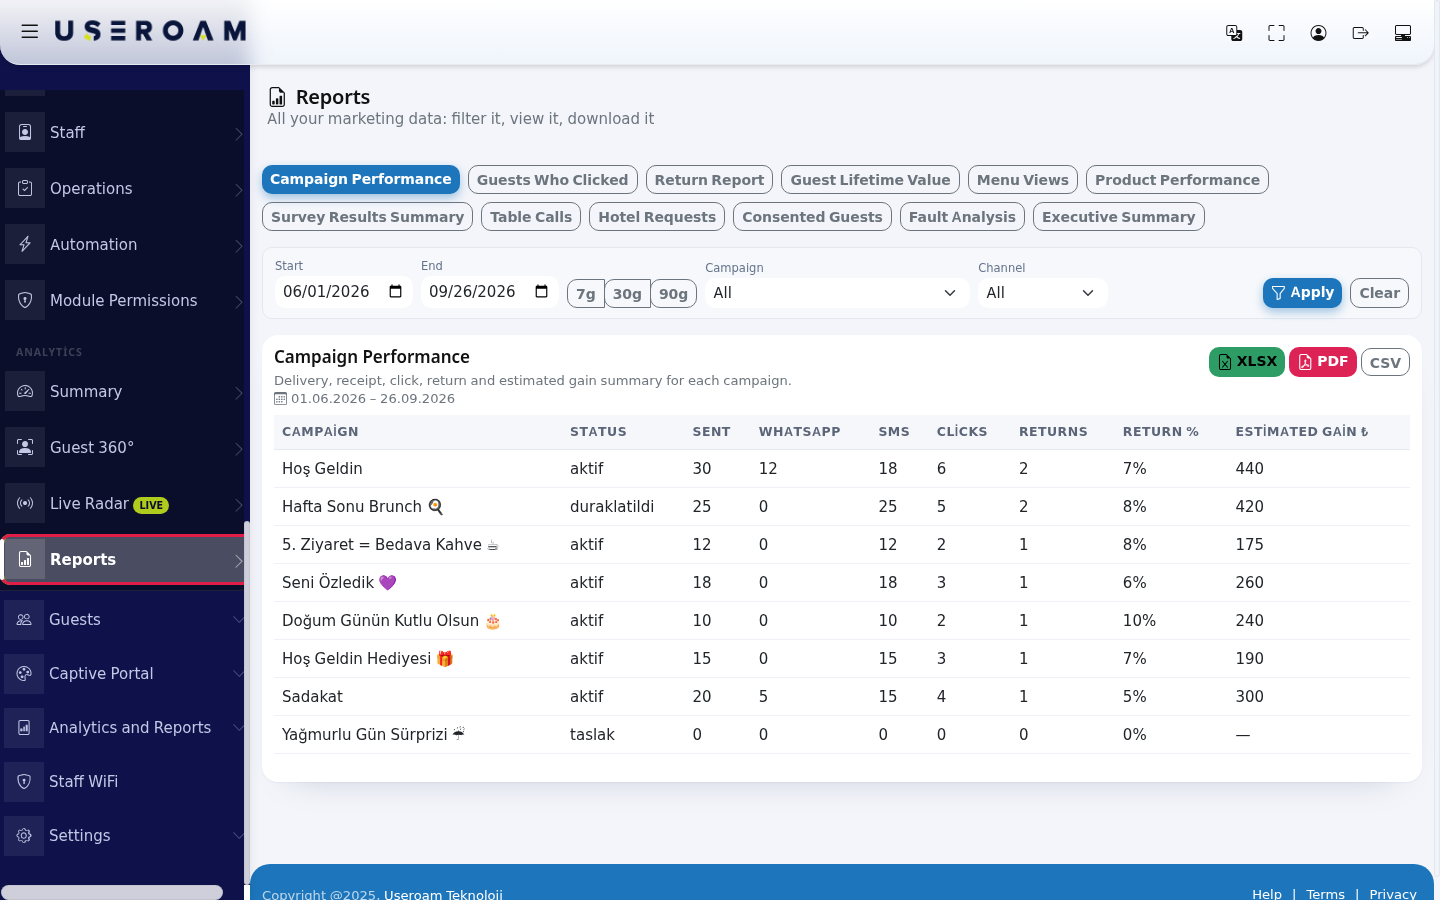
- Choose the report you want from the tabs at the top. The selected tab turns blue.

- Set the date range: type dates into Start and End, or press one of the quick buttons 7g, 30g, 90g (last 7, 30 or 90 days; the buttons keep the Turkish "g" for "gün", day, in the English interface). Quick buttons count back from today and refresh the report at once.

- If the report has its own filters (for example Campaign, Channel, Opened coupon menu), choose them and press Apply. Press Clear to reset the filters.

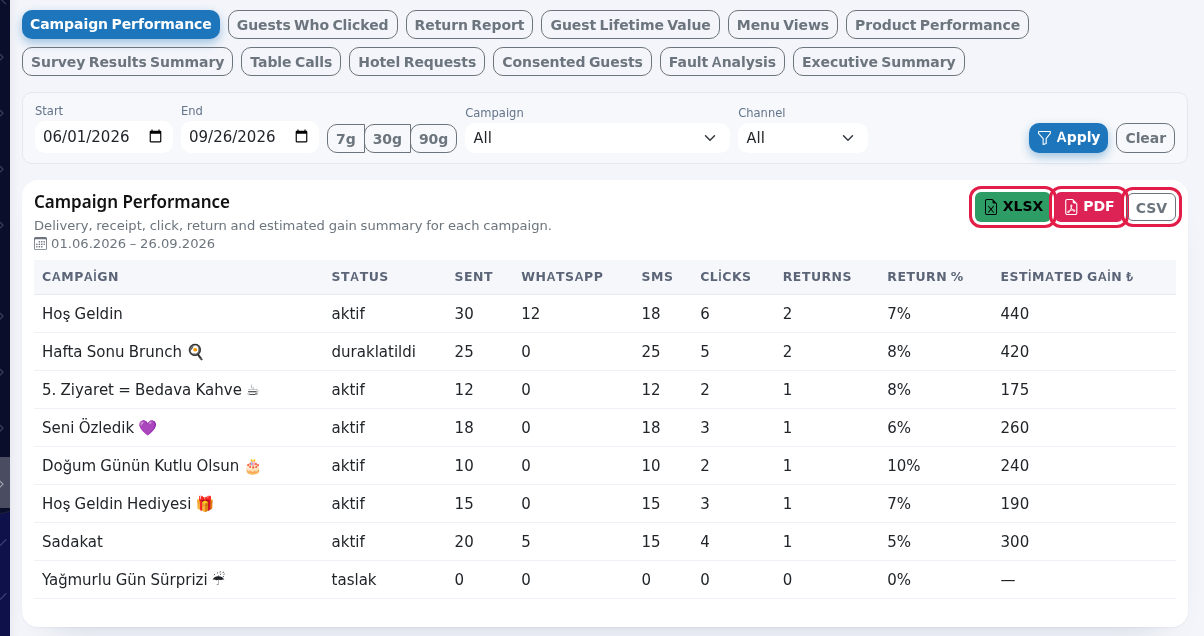
- Review the table. To get it as a file, press XLSX (Excel), PDF or CSV at the top right. The file uses the same filters as the screen.
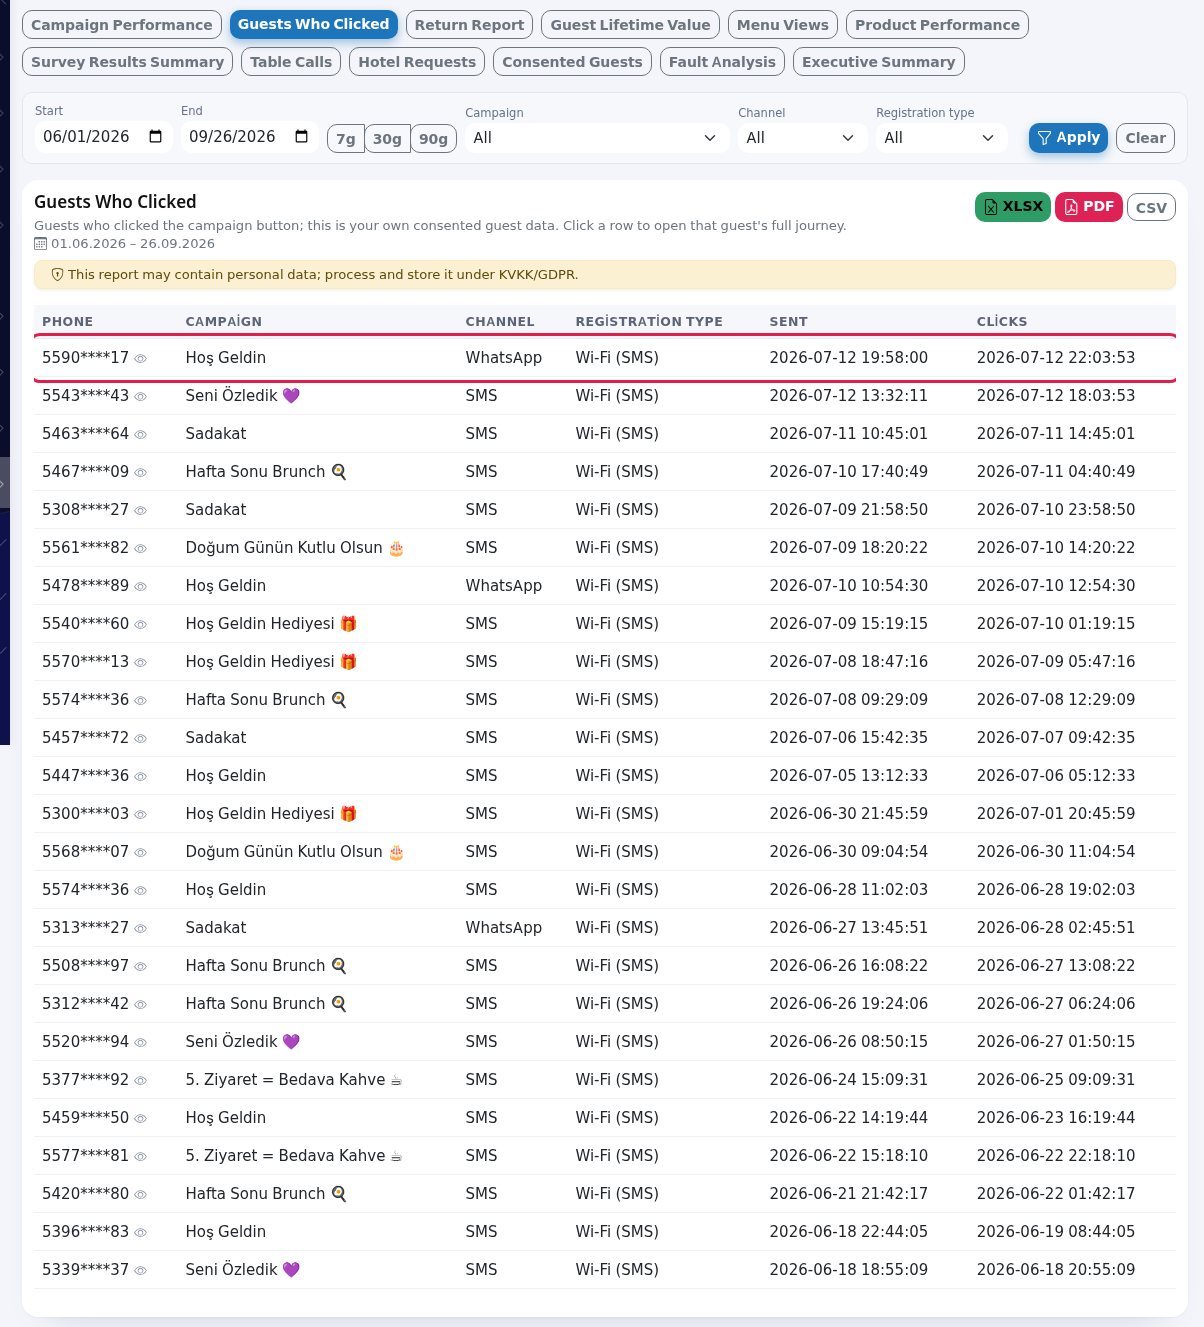
- Guest lists (Guests Who Clicked, Return Report, Guest Lifetime Value, Consented Guests) can be clicked row by row. Click a row.
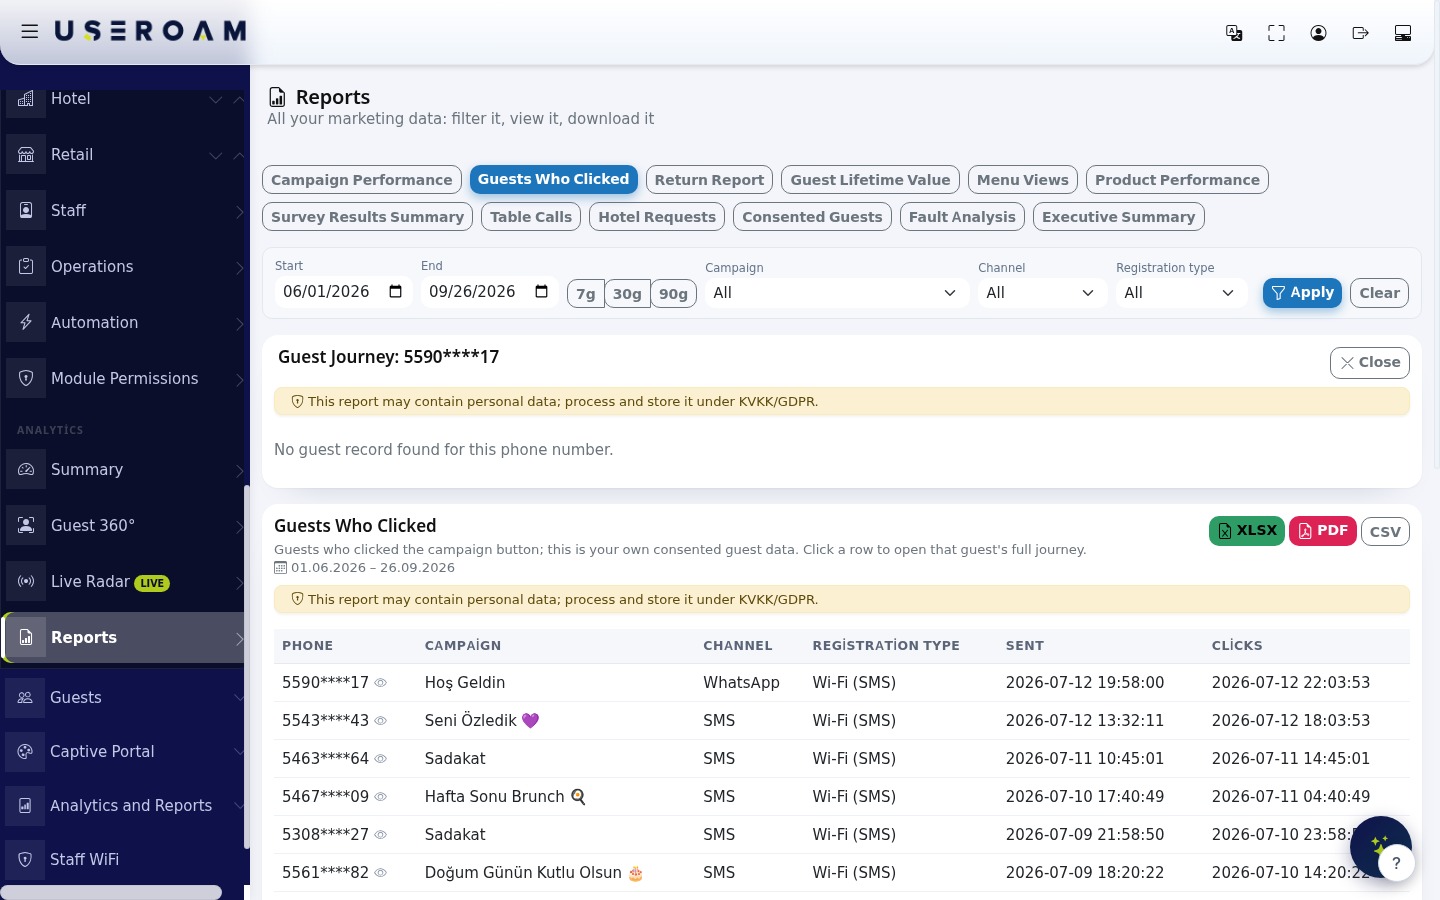
- A Guest Journey card opens above the table: every event from the guest's Wi-Fi registration to the campaign and the return visit, in date order. Press Close to close it.
Report tabs
There are 12 tabs. Under each tab title there is a short description and the selected date range.
| Tab | What it shows | Columns | Extra filters |
|---|---|---|---|
| Campaign Performance | Delivery, receipt, click, return and estimated gain summary for each campaign. | Campaign, Status, Sent, WhatsApp, SMS, Clicks, Returns, Return %, Estimated Gain ₺ | Campaign, Channel |
| Guests Who Clicked | Guests who clicked the button in a campaign message. This is your own consented guest data. | Phone, Campaign, Channel, Registration Type, Sent, Clicks | Campaign, Channel, Registration type |
| Return Report | Guests who came back after a campaign (14 day window) and how long it took. | Phone, Campaign, Channel, Message Date, Return Date, Elapsed (hours), With Coupon | Campaign, Channel, Opened coupon menu, Registration type |
| Guest Lifetime Value | The big picture per guest: how often they came, how they reacted to campaigns, their estimated total spend. | Phone, Registered, Total Visits, Last Visit, Campaigns Received, Clicked, Returned, Estimated Total Spend ₺ | Received a campaign |
| Menu Views | How many times your digital menu was opened, day by day. | Date, Views, QR, Wi-Fi, Campaign, Direct, Unique | Source (QR, Wi-Fi, Campaign, Direct), Language, Table |
| Product Performance | How often each product's detail was opened, and guest ratings. Review the ones at zero. | Product, Category, Detail Opens, Rating ★, Responses | Category |
| Survey Results Summary | Impressions and completions per survey. For question level detail use the report and export on the Surveys screen. | Survey, Impressions, Completed, Completion % | None |
| Table Calls | Waiter call and bill request records. | Date, Table, Type (Called a waiter / Requested the bill), Status (Answered / Pending) | Table |
| Hotel Requests | Housekeeping and extra requests from the guest portal. | Date, Room, Type, Detail, Preferred Time, Status, Amount ₺, Note | None |
| Consented Guests | The pool of guests who gave marketing consent. Details: Opted-in Guests. | Phone, Registration Type, Full Name, Registration Date, Last Login, Login Count, Overseas Consent | Channel |
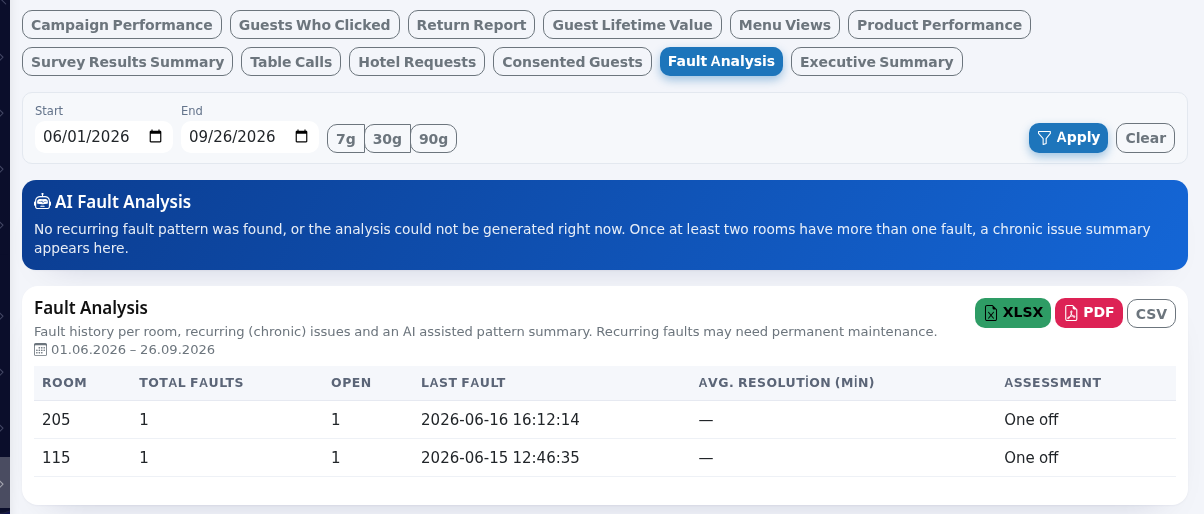
| Fault Analysis | Fault history per room, recurring issues and an AI summary. | Room, Total Faults, Open, Last Fault, Avg. Resolution (min), Assessment | None |
| Executive Summary | A one page summary of the whole marketing cycle, compared with the previous period. | Metric, This Period, Previous Period, Change | None |
In Hotel Requests, the Type column can be Housekeeping, Extra, Late Checkout, Early Check-in, Fault or Room Service. Status can be Pending, In progress, Completed or Cancelled. The Registration Type column shows where the guest came from: Wi-Fi (SMS) or Hotel (PMS). With Coupon shows Yes or No. Products without a category name show "Category #" and a number.
Executive Summary
A green gain card appears at the top of this tab: "Bumerang earned you an estimated ₺…", how many guests came back after a campaign in the period, and the change versus the previous period. The middle box shows the Proven campaign impact: the return with campaign rate, the organic return rate, and how many times more frequent returns guests with a campaign make.
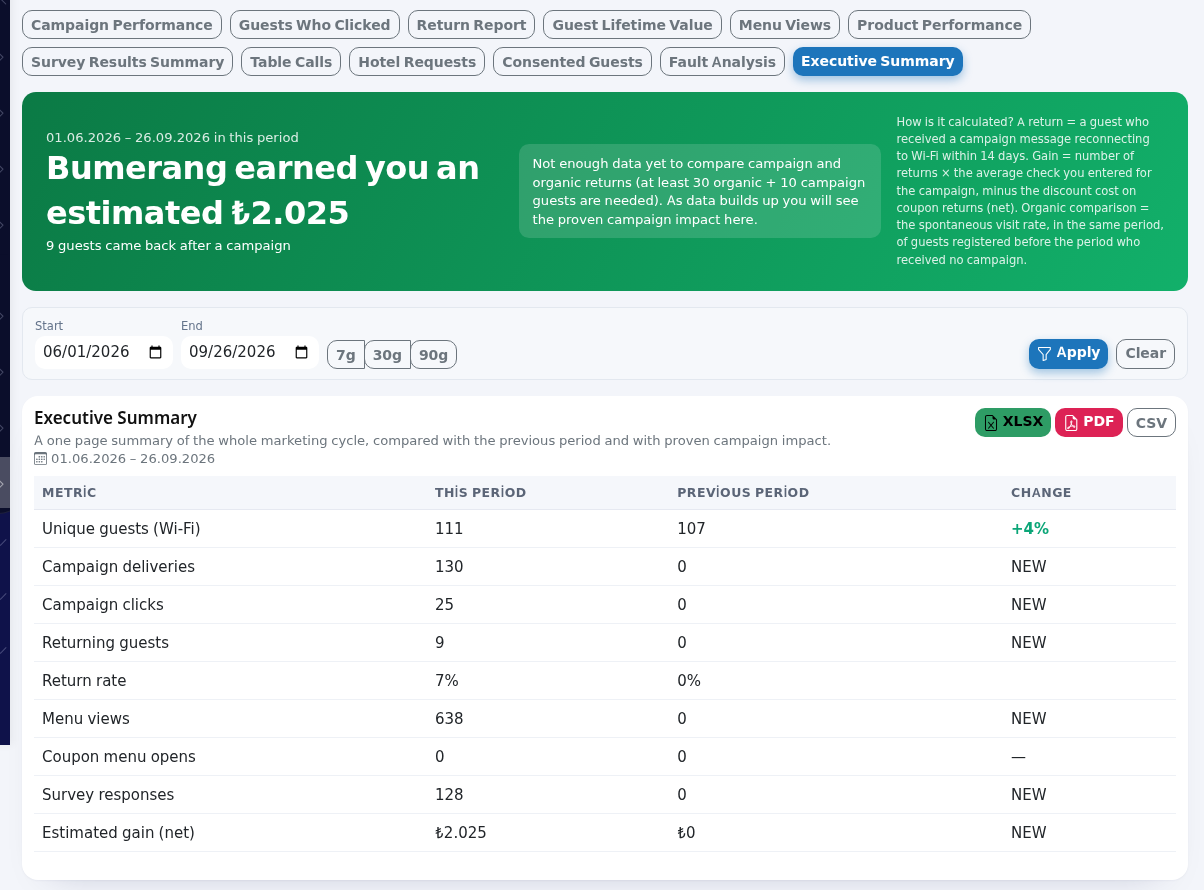
The table metrics are: Unique guests (Wi-Fi), Campaign deliveries, Campaign clicks, Returning guests, Return rate, Menu views, Coupon menu opens, Survey responses, Estimated gain (net). With enough data, three more rows are added: Return rate of guests with campaigns, Organic return rate (no campaign) and Campaign impact multiplier ("x more frequent returns"). The Change column shows increases in green and decreases in red; if the previous period is zero it shows NEW.
How is it calculated? It is also written on the right of the card: a return is a guest who received a campaign message reconnecting to Wi-Fi within 14 days. Gain is the number of returns times the average bill you entered in the campaign; for coupon returns the discount cost is deducted (net). The organic comparison is the rate at which guests registered before the period, who received no campaign, came back on their own in the same period.
Fault Analysis
If the hotel module is set up, this tab lists rooms by number of faults. The Assessment column has three values: One off, Recurring and CHRONIC (permanent maintenance advised). The AI Fault Analysis card above the table summarises the common pattern of recurring faults ("Summary generated with Groq; verify technical decisions with your own observation."). If no two rooms have more than one fault, the card says "No recurring fault pattern was found, or the analysis could not be generated right now."
Guest Journey card
It opens when you click a guest row. At the top: the phone number (masked), Registered:, Total visits: and Last visit:. Below: the events in date order (up to 60). The events you can see:
| Event | Meaning |
|---|---|
| Wi-Fi registration created / Joined your guest pool | The guest registered on Wi-Fi for the first time. |
| Visited the venue (Wi-Fi), "stayed connected … min" | A visit and how long the guest stayed on Wi-Fi. |
| Campaign "…" was sent, Coupon: … | A campaign message went to the guest; the coupon code is shown if there was one. |
| Clicked the campaign button | The guest pressed the button in the message. |
| CAME BACK to the venue, after campaign "…" | The guest came back within 14 days of the campaign. |
| Opened the coupon menu | The guest opened the menu link from the campaign. |
| Completed the survey | The guest answered a survey to the end. |
If the guest has no Wi-Fi record (for example only a campaign record), the card says "No guest record found for this phone number." If there are no events it says "No events recorded yet."
Other items on the screen
| Item | What it does |
|---|---|
| Start / End | Free date range. You cannot pick a date after today; the range is at most 365 days. If Start is after End, the two are swapped. |
| 7g / 30g / 90g | Selects the last 7, 30 or 90 days. The active one is darker. |
| Filter boxes | Each tab shows only the filters that fit that report. When a filter is set to All, nothing is filtered by that field. In Table you type a table number (example: 12). |
| Apply / Clear | Runs the filters / goes back to the tab's default. |
| XLSX / PDF / CSV | Downloads the report as Excel, PDF or CSV. The file contains all rows (up to 2000). |
| Yellow KVKK strip | "This report may contain personal data; process and store it under KVKK/GDPR." It appears on guest reports. |
| Masked phone and eye icon | Phone numbers are masked on screen and in the file, like 5590****17. If you have the View guest data (unmask) permission (Module Permissions), an eye icon appears next to the number; pressing it shows the full number. |
| "Showing the first 200 rows; the full set is in the download files." | The screen draws at most 200 rows; download the file for the rest. |
| "No data for this period and these filters." | There are no records in the selected range. Widen the date range or reset the filters with Clear. |
| Page tour | The first time you open the screen a short tour appears (Report types, Proof of gain, Filters, Download, Data table). You can close it; the question mark at the bottom right opens it again. |
Frequently asked questions
The report looks empty, but my campaign is running.
The default range is the last 30 days. If the campaign was sent earlier, press 90g or move Start back.
Why is the estimated gain zero?
Gain is calculated with the average bill you entered in the campaign. If the campaign has no average bill, the gain shows zero. Edit the campaign and enter the average bill.
Why are phone numbers starred in my download?
Under KVKK the numbers are masked in the file too. If you need the full number, ask your administrator for the unmask permission and use the eye icon on screen.
The tour says "nine ready reports", but I see 12 tabs.
The tour text is outdated; the screen has 12 tabs and all of them are described on this page.
Do my own staff appear in the reports?
Phone numbers on the Excluded Users list are removed from Guest Lifetime Value, Consented Guests and the unique guest count in the Executive Summary.