
Visit Analytics
What is it for?
TrafficVisit Analytics (the heading on the screen is Yoğunluk & VisitZiyaret AnalyticsAnalitiği, showsoccupancy and visit analytics) turns Wi-Fi connections into a picture of how busy your guestvenue trafficis: moveshow overmany time:different people came, on which days and hours areit gets busy, how manylong uniqueguests visitorsstay, arrive,how much data they use and how many ofcome themback.
When Itdo isI use it?
- You want the
pagebusiestyoudaysuseand hours for staffplanningplanning. - You wonder how long guests stay on average and whether they come back.
- To see whether visitor numbers changed after a campaign or event.
Before you start
- The numbers are calculated from the session records your firewall sends. If the device sent no session data in the last 90 days, a setup guide for
choosingyourwhenfirewall brand appears (… RADIUS accounting kapalı görünüyor, RADIUS accounting appears tosendbecampaigns.off);once
HowthatdosettingIisopenmade,thisthescreen?numbersFromfill by themselves. - Employees on the Excluded Users list are not counted.
- This screen is in Turkish only, also in the English interface. The English names below are for guidance.
Step by step
- In the left
menu,menugo toopen Analytics and Reports→and click Visit Analytics.Note:this screen's labels are still shown in Turkish; the on-screen text is given in brackets.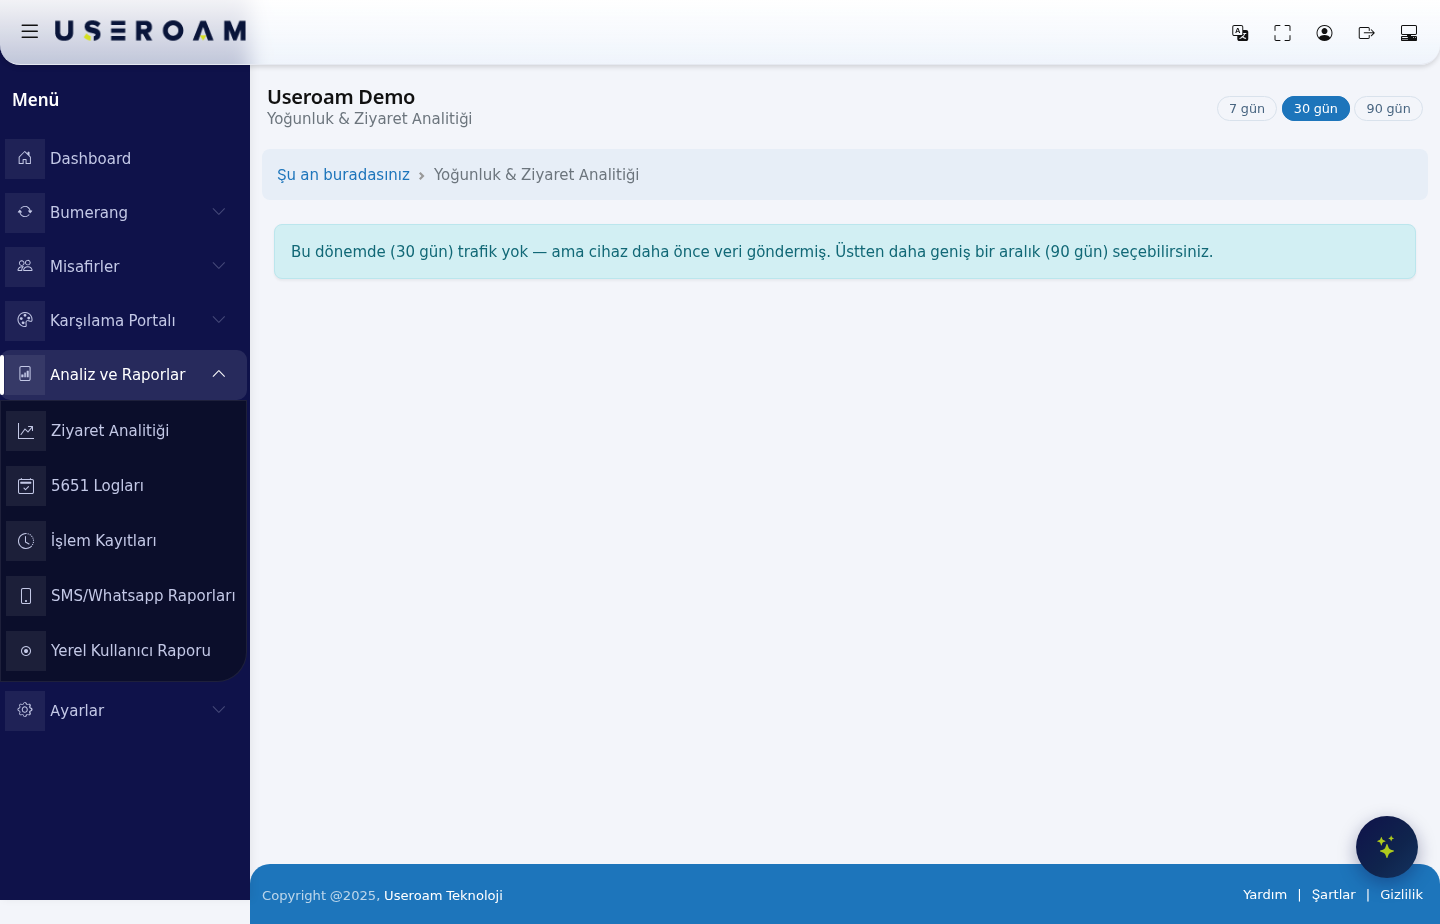
ChoosingChoose the period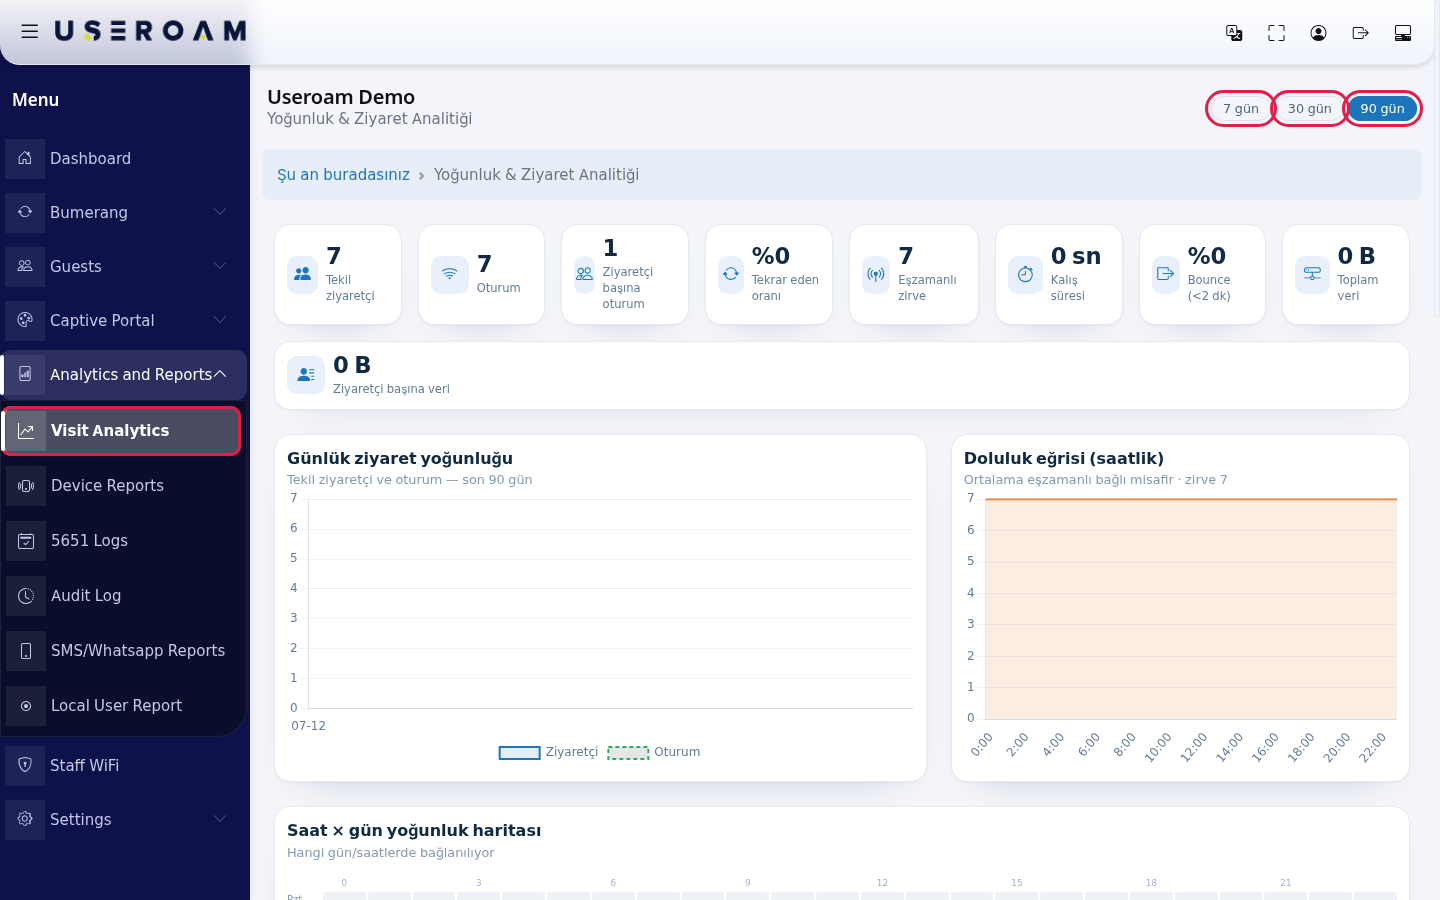
- Look at the
page:summary boxes:7Tekildaysziyaretçi (7uniquegün)visitors),30 daysOturum (30 gün) andsessions),90Ziyaretçidaysbaşına oturum (90sessionsgün)per visitor), Tekrar eden oranı (returning rate), Eşzamanlı zirve (concurrent peak), Kalış süresi (dwell time), Bounce (<2 dk), Toplam veri (total data), Ziyaretçi başına veri (data per visitor).
- The
rangeGünlükyouziyaretpickyoğunluğurefreshes(dailyeveryvisit density) charton the page together. The default is 30 days.7 days:to see the weekly rhythm — which day is busy, how different the weekend is.30 days:for the general trend and the effect of campaigns.90 days:to see seasonal movement and longer-term growth.
What you see when there is no dataIf there was no traffic in the selected period, the page says so explicitly:"There was no traffic in this period (30 days) — but the device has sent data before. You can select a wider range (90 days) above."This message lets you tell two situations apart:the device has never sent data(an installation or log-flow problem) versusthe device has sent data but there was no traffic in this period(a genuinely quiet stretch). In the second case, simply widen the range.If no data arrives at all:check the5651 live log streamcard on the Dashboard. If it reads "Log data could not be retrieved", the syslog configuration on your firewall may be broken — verify the syslog steps in theInstallation Guides.The analyses on this pageVisit trend:the daily movement ofshows unique visitors and sessionsinfor each day.
- The Doluluk eğrisi (saatlik) (hourly occupancy curve) shows how many guests are connected at the
selectedsameperiod.time on average in each hour; the highest value is shown as zirve (peak).
- In the
NewSaat/×returninggünguests:yoğunluk haritası (hour × day heat map) dark squares are the busiest days and hours (rows Monday to Sunday, columns hours 0-23).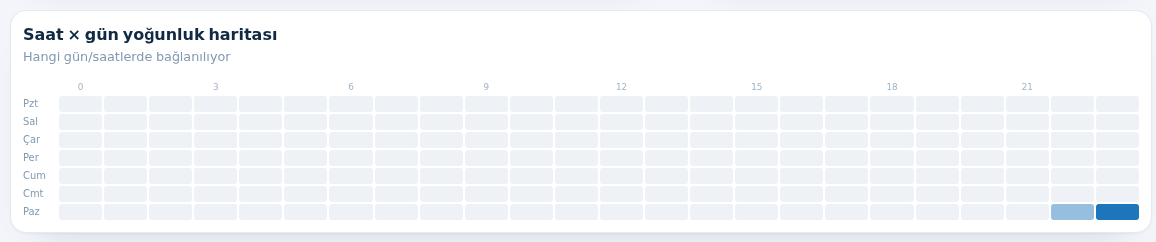
- The Günlük veri kullanımı (GB) (daily data use) and Oturum veri dağılımı (session data distribution) cards show how much data was used. The distribution groups sessions into 0 / veri yok (no data), <100 MB, 100 MB–1 GB, 1–10 GB and 10 GB+.
- The Kalış süresi (dwell) card shows Medyan (median: half of
yourgueststrafficstayisshorter),first-timeOrtalamaversus(average),returningP90—(uzun kalanlar) (long stayers) and Bounce (<2 dk). The En çok veri tüketen (top data users) list next to it shows the guests who used the mostdirectdatameasureinoftheyourperiod.loyalty
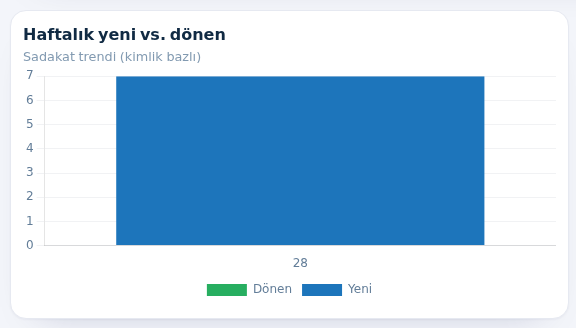
- The Haftalık yeni vs. dönen (weekly new vs returning) chart compares, week by week, first-time guests with guests who came before (Yeni / Dönen).
HourGiriş× day heatmap:a heat map crossing days of the week with hours, showing your busiest slot.
work.How to use it:find your busiest slot and schedule campaign sends one to two hours before it. You can fill the quiet hours with off-peak offers.Related pages:Dashboardyöntemi (summarysign-infigures),method) shows how guests signed in (Bumerang → SummarySMS,BumerangOtel→hotel,GuestDiğer360°other).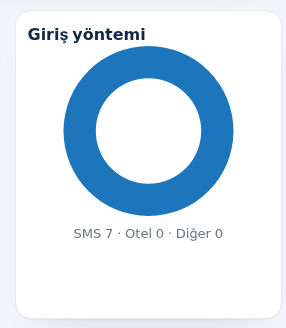
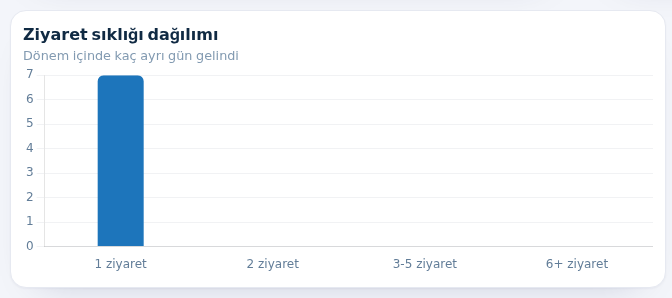
- Ziyaret sıklığı dağılımı (visit frequency) shows on how many different days guests came in the period (1 ziyaret, 2 ziyaret, 3-5 ziyaret, 6+ ziyaret), and En sadık ziyaretçiler (most loyal visitors) lists the most frequent ones. If nobody came back it says "Tekrar eden ziyaretçi yok." (no returning visitors).
- At the bottom, the Bölge / AP analitiği (area / access point analytics) card is for density per access point. If your firewall does not send access point details in its connection records, it says "veri yok" (no data) and explains that the map fills by itself once this is enabled.

Terms
| Term | Meaning |
|---|---|
| Unique visitors | Number of different people who connected in the period (someone who came 10 times counts once). |
| Session | Each connection. A guest can open several sessions in a day. |
| Returning rate | Share of guests who came on more than one day. |
| Concurrent peak | The highest number of guests connected at the same time. |
| Dwell time | How long a guest stayed connected in one session. |
| Bounce (<2 dk) | Share of sessions shorter than 2 minutes: people who connected and left at once. |
| P90 | 90 percent of sessions are shorter than this; it describes the longest-staying 10 percent. |
Frequently asked questions
All numbers are zero.
There is no session data in the period you chose. Switch to 90 gün; if it is still empty and the setup guide appears, session recording (accounting) is off on the firewall.
Dwell time shows 0.
Your firewall may not report session ends. Then time and data figures stay incomplete; contact support to have your setup checked.