
Active Guests
What is it for?
Active Guests shows the guests connected to your Wi-Fi right now: who, since when, which IP address they received and how much data they downloaded and uploaded. If your firewall is connected to the panel, you can also disconnect a guest from here.
When do I use it?
- You want to see how many people are using the Wi-Fi at the moment.
- A guest says "I have no internet" and you want to check whether they appear connected.
- You want to find a connection that uses a lot of data.
- You want to cut off a guest who causes trouble right away (only on devices whose firewall is connected to the panel).
Before you start
- The list shows the guests of the selected device. The device name is shown in the heading (example: Useroam Demo). To see another location, change the device on the Device Selection screen first.
- Employees on the Excluded Users list are not shown here.
- Guest numbers and device addresses (MAC) are masked under the Turkish data protection law, KVKK (example:
5417****71,6F:2D:B5:**:**:**).
Step by step
- In the left menu open Guests and click Active Guests. The green badge at the top right shows the current number of connections (example: 10 active sessions).
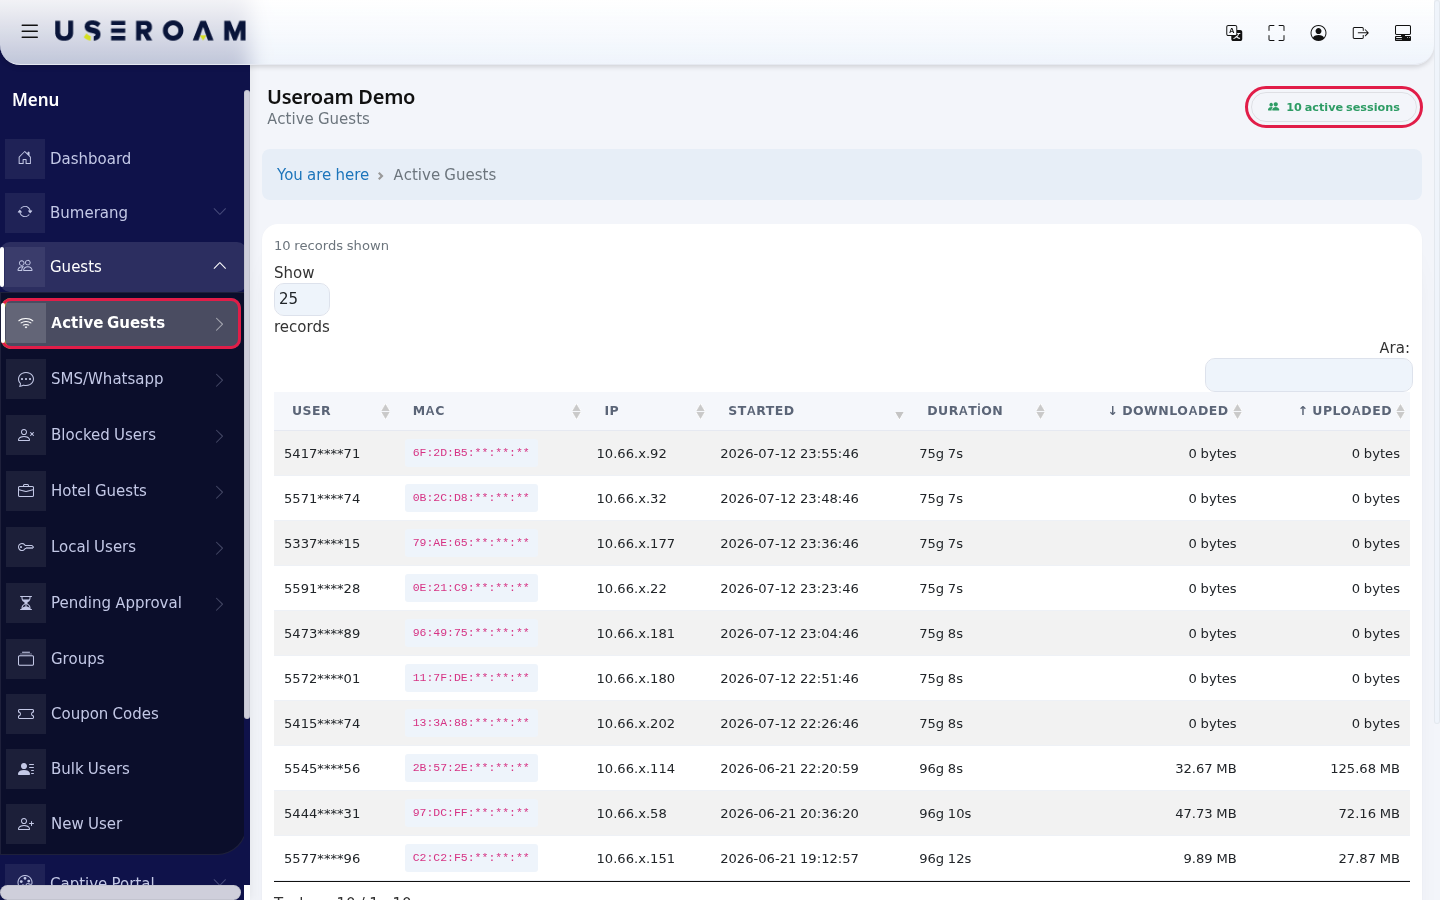
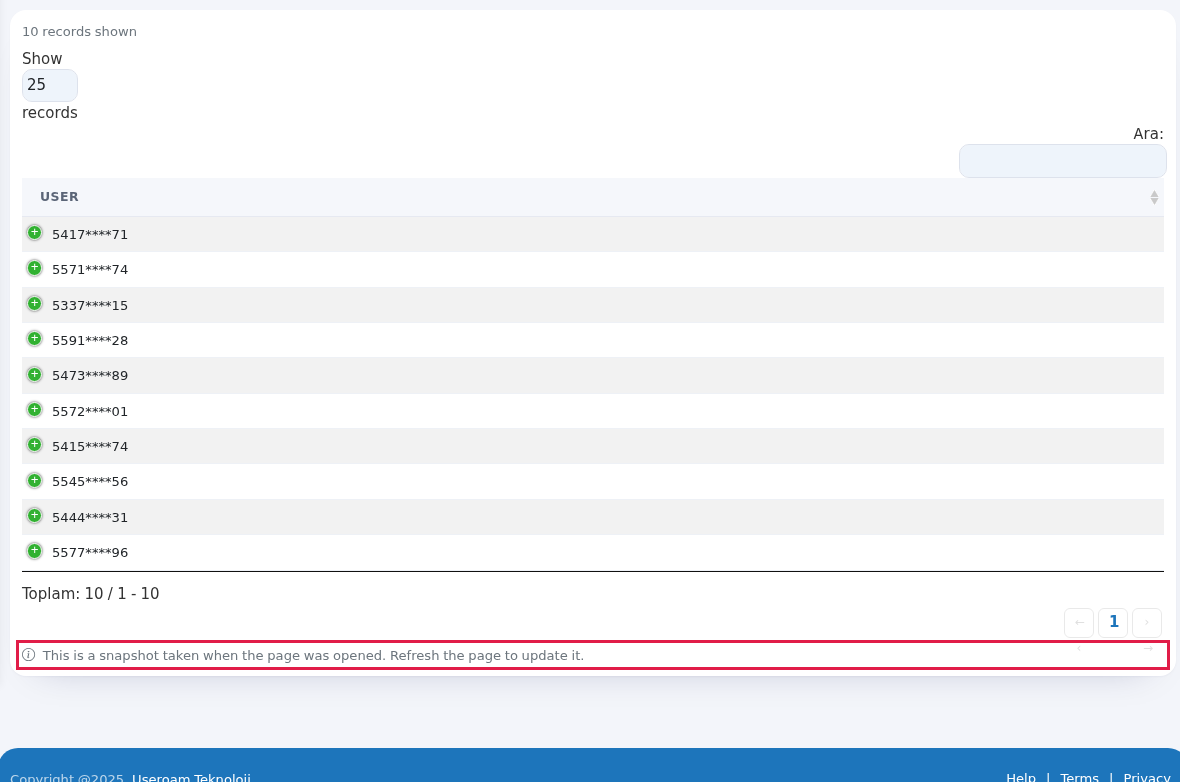
- Look through the table. To find a guest, type the visible part of their number or their IP address in the search box at the top right (its label is still Turkish: Ara:). Choose how many rows to show with the box at the top left (10, 25, 50, 100 or All). On narrow screens such as phones some columns are hidden; press the green + at the start of a row to open them under the row. Click a column heading to sort by that column; for example click ↓ Downloaded to find who used the most data.
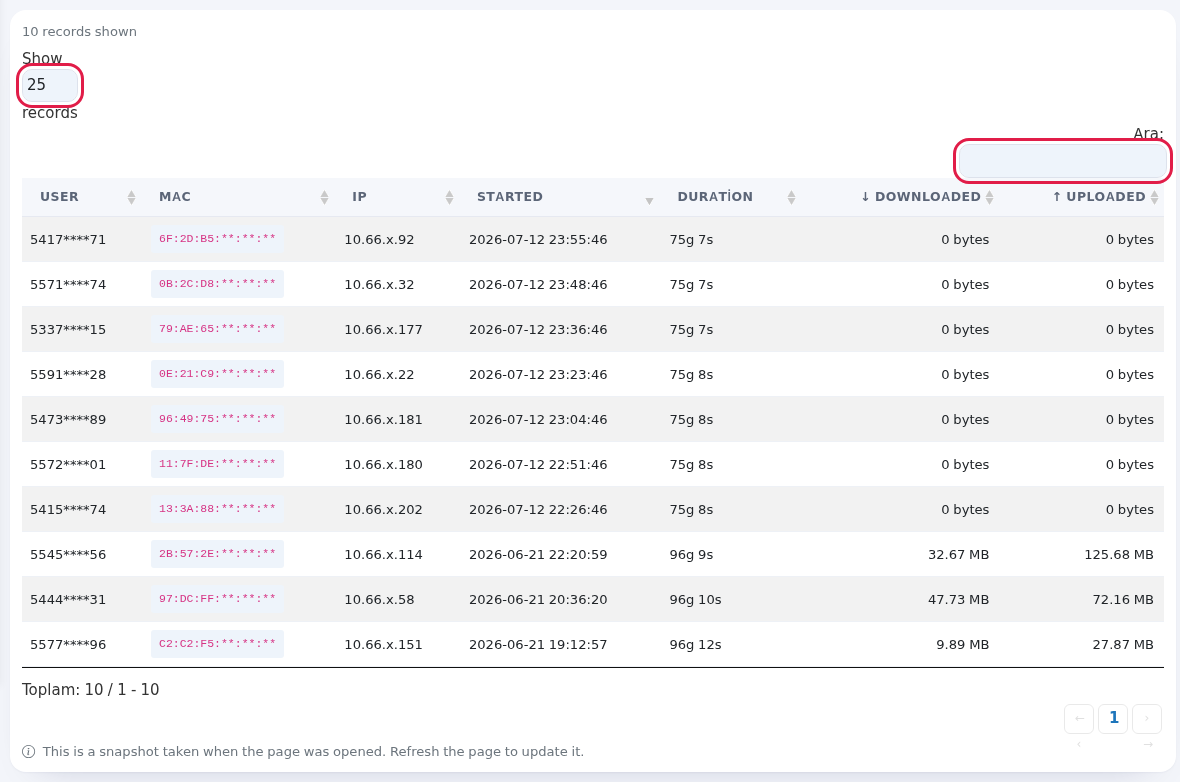
- The list is a snapshot of the moment you opened the page and does not refresh by itself. Reload the page in your browser to see the current state. The note under the table says the same: "This is a snapshot taken when the page was opened. Refresh the page to update it."
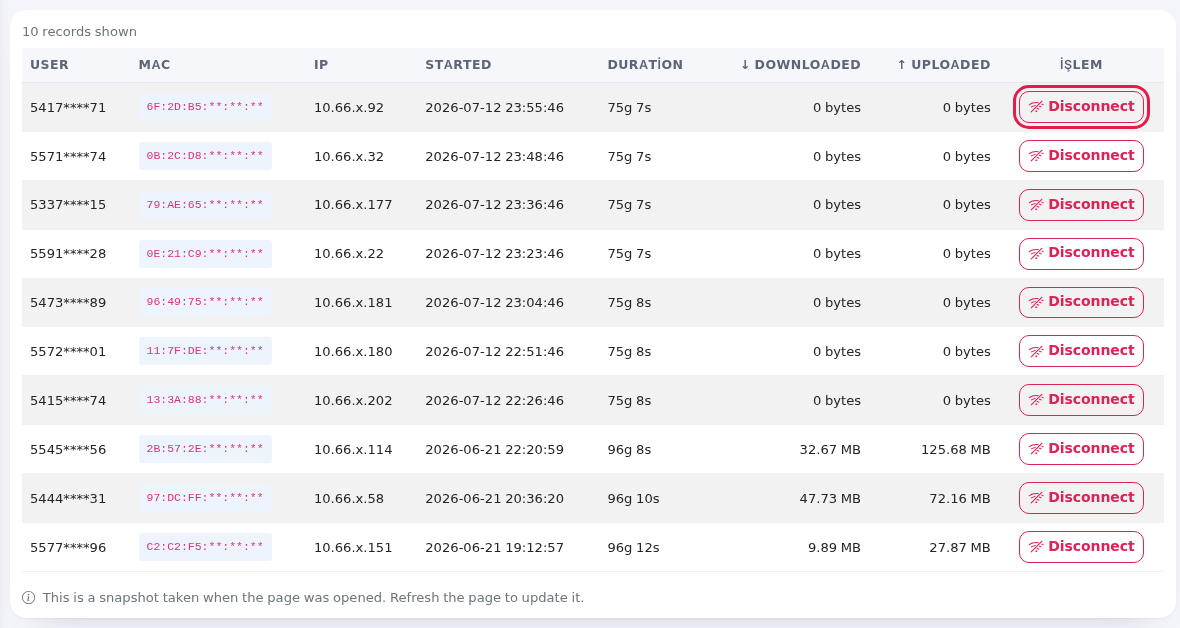
- If your firewall is connected to the panel, an extra column appears (its heading is still Turkish: İşlem, "Action"). To disconnect a guest press Disconnect on their row and confirm "… do you want to terminate this firewall session?". The button turns into Terminated and the row fades. The guest can sign in again if they want; to block them permanently use the Blocked Users screen.
Every field and button on the screen
| Field / Button | What it does |
|---|---|
| Top of the page and table footer | You are here in the path line returns to the home screen. The box at the top left reads like "Show 25 records". With no rows the table says No records; paging uses First, ‹, ›, Last. |
| Heading (device name) and Active Guests | Which device's guests you are looking at. |
| … active sessions (green badge) | Number of connections open now. |
| … records shown | Number of rows loaded into the table. At most 1000 connections are listed; if there are more, "(ilk 1000, toplam …)" (first 1000, total …) is shown next to it. |
| Firewall live list (real-time sessions) | Shown on devices whose firewall is connected to the panel: the list comes straight from the firewall and is the most up to date. In this case the MAC column stays empty (the firewall does not report MAC). |
| User | The guest's login name; usually the phone number (masked). For hotel logins it can be a room number or an ID number. |
| MAC | Device address, first half visible. If the same person has two devices, there are two rows. |
| IP | Local address given to the device. |
| Started | Date and time the connection opened. The table is sorted newest first by this column when it opens. |
| Duration | How long it has been connected. The units stay Turkish: sn seconds, dk minutes, s hours, g days (example: 75g 7s = 75 days 7 hours). |
| ↓ Downloaded, ↑ Uploaded | Data downloaded and uploaded during the connection. |
| Disconnect | Only on devices whose firewall is connected to the panel. Ends the connection. |
| Number box at the top left | Rows per page: 10, 25, 50, 100, All. 25 when the page opens. |
| Search box (Ara:) | Searches all columns instantly. |
| Toplam: … / … - … | Total rows and the range shown (label still Turkish: "Toplam" = Total). Change pages with First, ‹, ›, Last at the bottom. |
Messages you may see
| Message | Meaning / what to do |
|---|---|
| There are no active guests right now. | Nobody is connected at the moment. |
| No matching records found | No row matches your search. Clear the search box. |
| Firewall live list could not be retrieved; showing the RADIUS record instead. | The firewall could not be reached at that moment. The list is shown from login records; some old connections may still look open. Reload the page a little later. |
| The active device could not be resolved. Select a device from the left menu. | No device is selected. Select one on the Device Selection screen. |
| Card "… RADIUS accounting kapalı görünüyor" (RADIUS accounting appears to be off) | If the device sent no session data in the last 90 days, a setup guide for your firewall brand is shown instead of the list (Sophos, FortiGate, MikroTik, Palo Alto and others; the card is in Turkish only). Apply the setting or pass it to the company that installed your firewall; the list fills by itself afterwards. |
| Could not be terminated (…) | The connection could not be ended. The guest may have left in the meantime; reload the page and try again. |
| Connection error. | The connection between the panel and the server dropped. Check your internet and try again. |
Frequently asked questions
The guest left but still appears on the list.
Some firewalls do not report when a connection ends; such connections can stay open on the list for a long time (the Duration column shows days and the data counter does not grow). On devices whose firewall is connected to the panel, the list is read live from the firewall, so this does not happen.
I cannot see the Disconnect button.
The button only appears on devices with a firewall API connection. See Sophos Firewall API Setup.
The guest I disconnected connected again.
Disconnecting only ends the current connection. If you do not want the guest back, add their number to Blocked Users.
Where do I see past connections?
On the All Connections and Device Reports screens.