
Dashboard (Home Screen)
The Dashboard is the home screen that opens when you select a device. It shows the live state of the selected business (device), the last 30 days of visits, Bumerang marketing results and 5651 log health on one page. You do not change anything here; you look and jump to the related screen.
What is it for?
At the start of the day it answers at a glance: "Is the Wi-Fi working, how many guests came today, are logs being recorded, when does my licence end?"
When do I use it?
- On every sign-in (it opens after device selection), and via Dashboard in the side menu or the USEROAM logo at the top.
- To check for a sudden drop in guests.
- To see that the 5651 log stream and signing are healthy.
Before you start
- Data belongs to the device you selected. For another branch, switch in Device Selection.
- Sections depend on your package: Bumerang sections only with the marketing package; visit and guest charts not with the 5651-log-only package. People on the Excluded Users list (your staff) are not counted.
Step by step: reading the screen top to bottom
Step 1: Top card (live view)
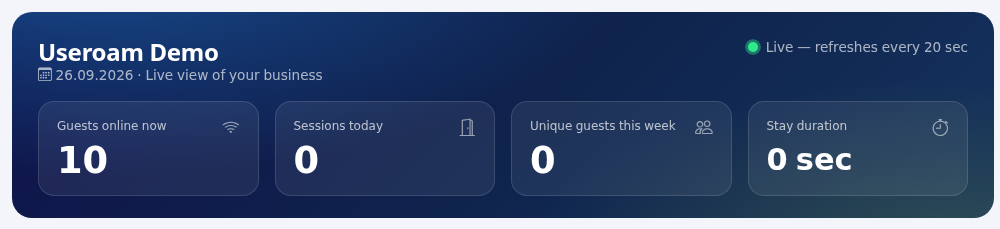
At the top: the device name, today's date and "Live view of your business". At the top right a blinking green dot and "Live, refreshes every 20 sec": the first two numbers update every 20 seconds without reloading.
- Guests online now: guests with an open Wi-Fi session right now.
- Sessions today: sessions opened since midnight.
- Unique guests this week: different guests in the last 7 days.
- Stay duration: typical (median) session length in the last 30 days, shown as sec, min or "1h 20m".
Step 2: Useroam AI · Autopilot band (marketing package)
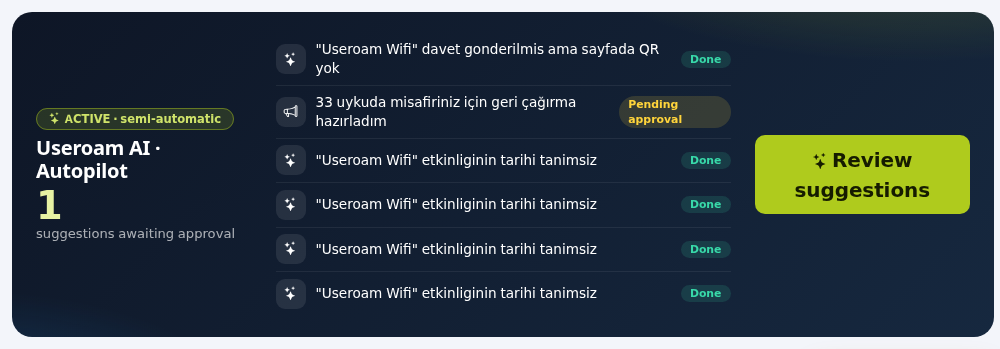
The badge on the left shows the state: ACTIVE · semi-automatic, ACTIVE · fully automatic or OFF. When active, the big number is "suggestions awaiting approval". The middle lists the last 6 activities with a Pending approval (yellow) or Done (green) badge. The green button reads Review suggestions, Go to Autopilot or Turn on Autopilot and opens Autopilot.
When off, an intro text appears: "Monitors your business 24/7, spots opportunities and drafts campaigns; you just approve." With no activity: "No activity yet. Autopilot will analyze your business on its first run." (Activity titles come from the data and may be Turkish.)
Step 3: Bumerang counters (last 30 days)
Five coloured boxes: Active campaigns, Sends · 30d, Clicks · 30d, Returning guests (with a percentage) and Net revenue · 30d (in TL if an average bill was entered in campaigns, otherwise a dash).

Step 4: Bumerang cycle and top campaigns
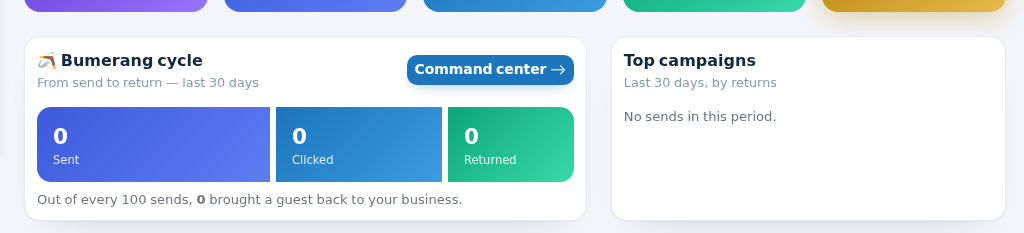
The Bumerang cycle card shows "From send to return, last 30 days" in three bars: Sent, Clicked, Returned, followed by "Out of every 100 sends, X brought a guest back to your business." Command center opens Summary.
Top campaigns ("Last 30 days, by returns") lists the 3 campaigns that brought most guests back, with sends and a returns badge. With no sends: "No sends in this period."
Step 5: Visit trend and New / Returning guests
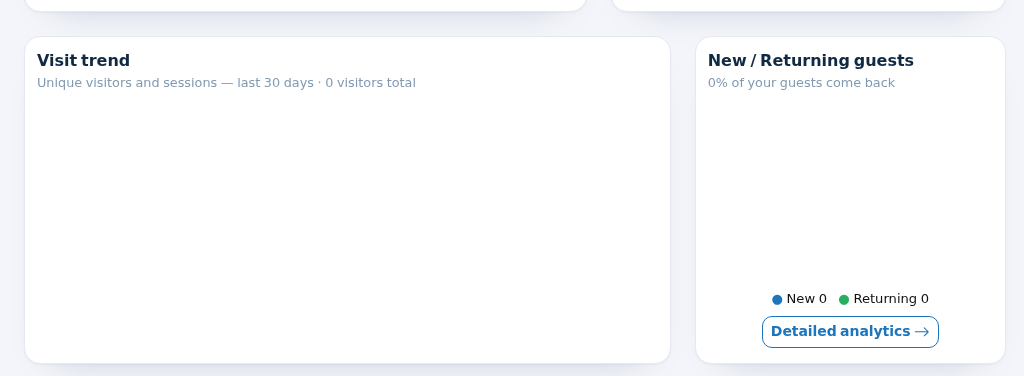
The Visit trend chart shows Visitors (blue area) and Sessions (green dashed line) for each of the last 30 days; the subtitle gives the total. The New / Returning guests ring compares first-time and repeat guests ("X% of your guests come back"). Detailed analytics opens Visit Analytics.
Step 6: Heatmap and last connections
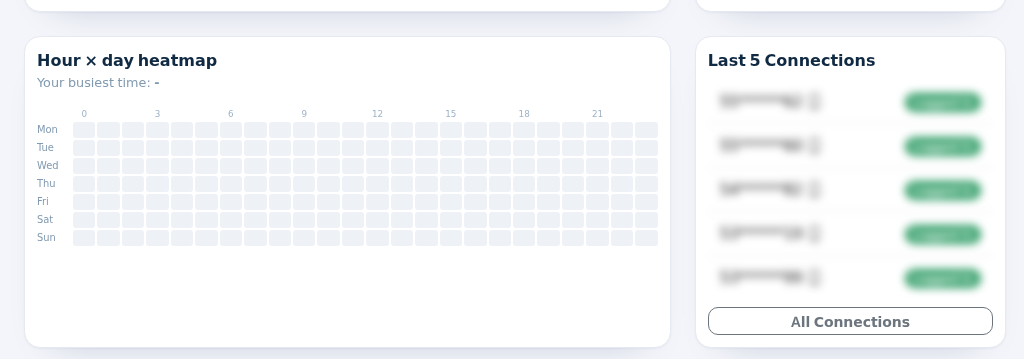
The Hour × day heatmap shows weekdays (Mon to Sun) against hours (0-23); the darker the square, the more sessions started then. Hover for the exact number. The subtitle says "Your busiest time:" (e.g. Fri 20:00). Handy for staff planning.
Last 5 Connections lists the 5 most recent guests with a sign-in type icon (refreshes every 2 minutes). All Connections opens All Connections. (Guest details are hidden in the image.)
Step 7: Guest profile, cities and signup channel
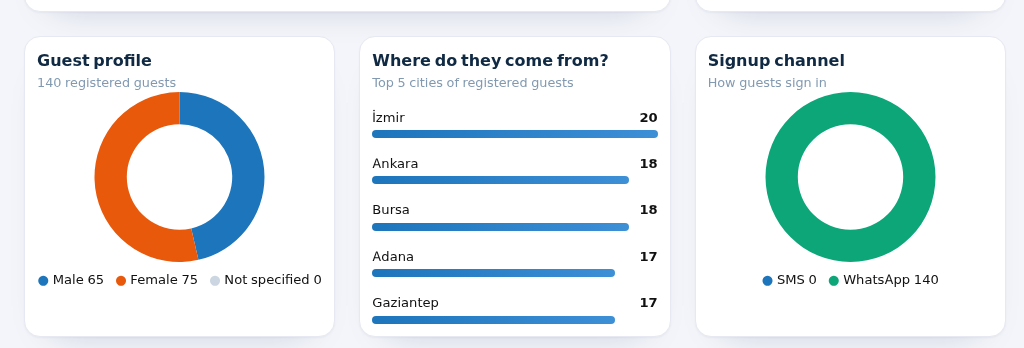
- Guest profile: registered guests and the Male / Female / Not specified split.
- Where do they come from?: "Top 5 cities of registered guests" as bars. Without data: "No city data yet."
- Signup channel: "How guests sign in": guests registered via SMS and WhatsApp.
Step 8: System health (5651, licence, device)
- 5651 live log stream: chart of log volume from the device, updated every 5 seconds. The subtitle gives the state: "Log stream healthy · Uptime 100%", "Log stream interrupted (X sec)" (red) or "Could not fetch log data" (red). While loading it says "connecting…".
- 5651 signing: Waiting (size of logs not yet signed), Signed / Stamped (size of archived logs), the To be signed bar (percentage of 10 GB; yellow at 60%, red at 90%) and Next Signing ("26 min", "Calculating..." or "In the next round"). Logs are time-stamped every night and whenever 10 GB fills up.
- License: Active (green), "X days left" (yellow at 30 days or less) or Expired (red), with the end date.
- Device: device type (Sophos, MikroTik...) and IP address.
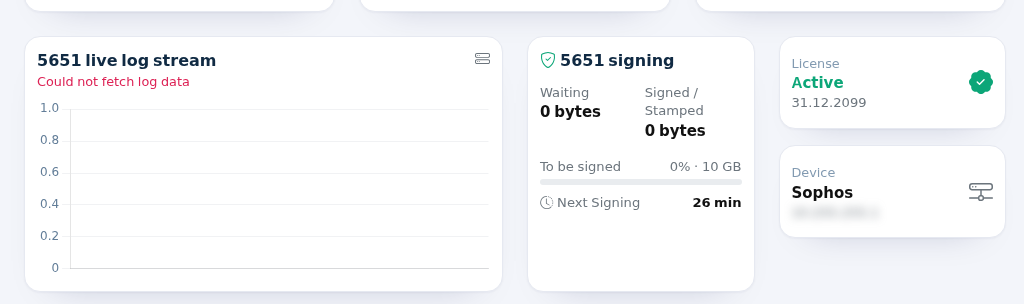
The demo device in the image sends no real logs, so it reads "Could not fetch log data"; with logs flowing you see the green "Log stream healthy".
Boxes that appear in special cases
| Box / Message | When | What to do |
|---|---|---|
| License expired! "Your license expired on [date], user logins have been stopped automatically..." (red box at the top) | The licence end date has passed and the licence is inactive. | Contact your sales representative or dealer. Guests cannot sign in meanwhile. |
| Accounting setup guide for your device (orange-headed card, currently Turkish only) | No session record has come from this device in the last 90 days. Instead of charts you see steps for turning on RADIUS accounting for your brand (FortiGate, Sophos, MikroTik, Palo Alto...). | Apply the steps on your device or pass them to your installer. Charts appear once data arrives. |
| Purple intro card: "{X} guests visited in the last 30 days." or "Are your guests coming back?" | You do not have the marketing (Bumerang) package. | Start the 10-Day Demo opens a free discovery demo ("sending unlocks with purchase"). If the demo was already used, I'm interested, call me leaves a request for sales; then "Request received" is shown. |
| "Request received, our sales team will contact you shortly." (green) | After I'm interested, call me. | Nothing to do. |
| Stay duration shows a single dash | 5651-log-only package. | Normal. |
Frequently asked questions
"Guests online now" looks higher than reality. Some devices do not send "session ended" when a guest leaves, so such sessions may count as open for a while. See the live list in Active Guests.
The charts are empty. If no session data comes from your device, the accounting setup guide appears; follow it. On a new device data takes a few days to build up.
Are my staff counted? People you add to Settings, Excluded Users are not counted on the Dashboard.
It says the log stream is interrupted. No logs have come from the device for a while. Check that it is on and online; contact Useroam support if it continues. 5651 logging is a legal requirement in Turkey.
Another branch's Dashboard? Use the Device Selection icon in the top bar.