
Menu Report
What is it for?
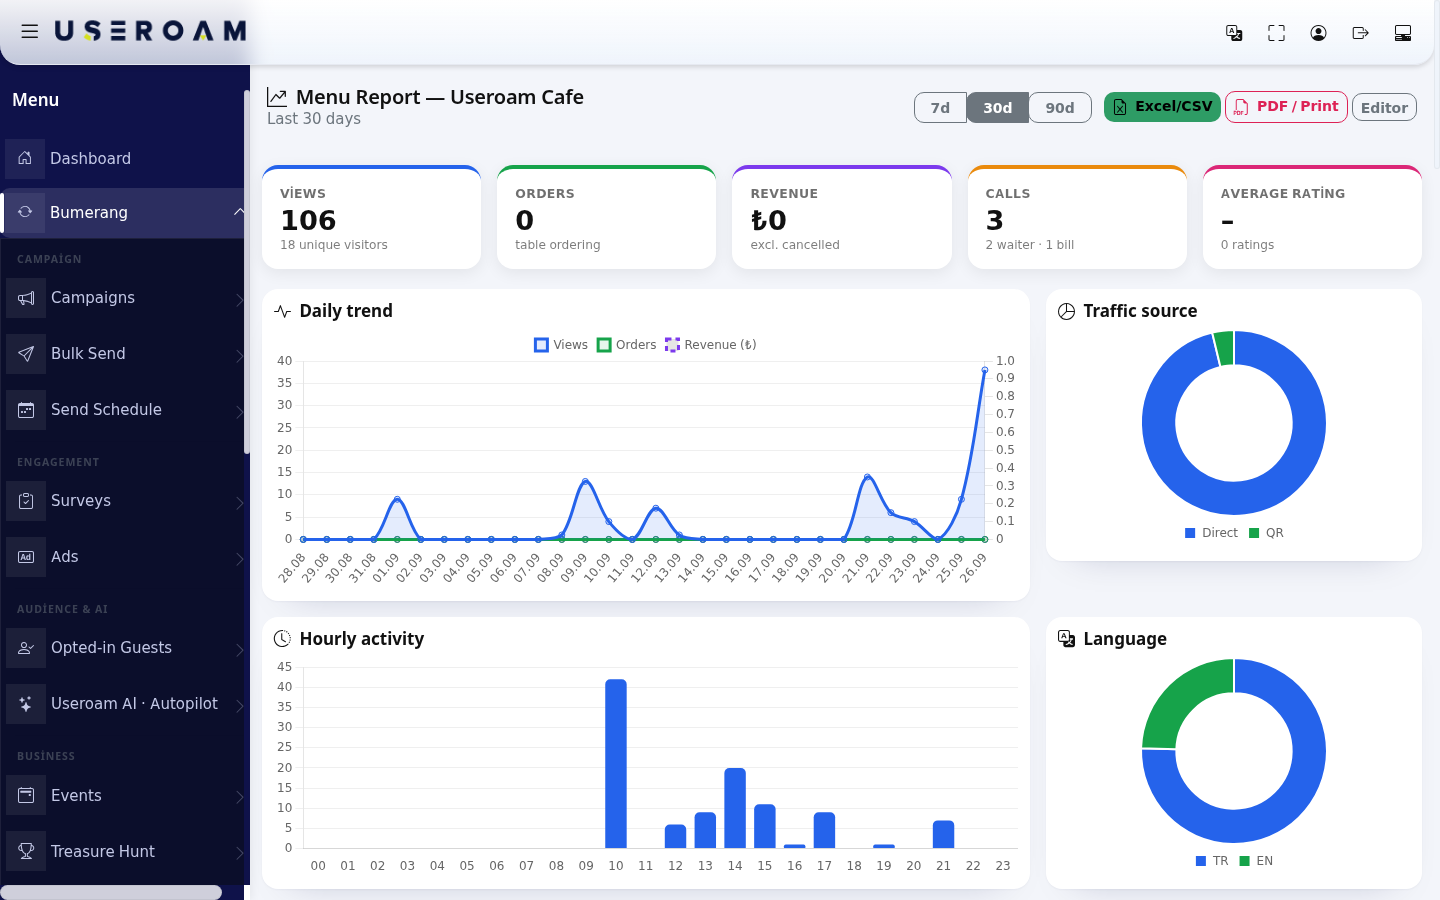
How do I open this screen? Click Report on the menu card under Restaurant → Menus, or Report at the top of the Menu Editor.
When do I use it?
- Before reviewing menu prices and layout.
- When deciding which item to promote or remove.
- When preparing a combo or "goes well with" suggestion.
- To read the feedback guests left on the welcome page.
Step by step
- Choose the period at the top right: 7d, 30d or 90d (days). The report is recalculated for that period. Excel/CSV downloads a summary, PDF / Print opens a print view, Editor goes back to the Menu Editor.
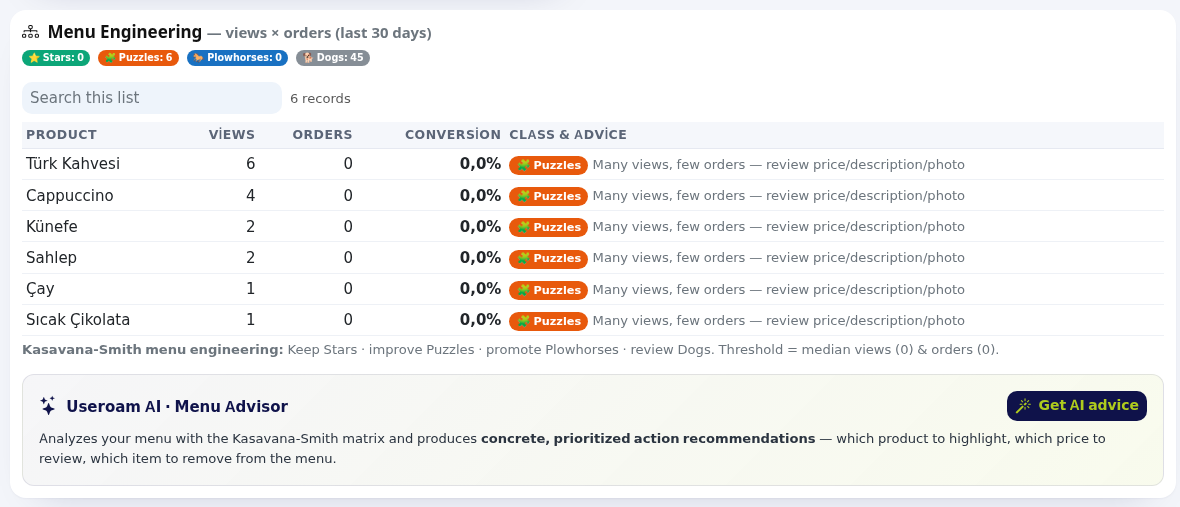
- In the Menu Engineering table, check each item's class and apply the advice; click Get AI advice if you like.
- Find combo opportunities in the Ordered Together table.

Summary cards and charts
| Card / chart | What it shows |
|---|---|
| Views | How often the menu was opened; unique visitors below ("18 unique visitors"). |
| Orders | Orders from tables (table ordering); ordering off when disabled. |
| Revenue | Value of table orders (excl. cancelled). |
| Calls | Waiter calls and bill requests ("2 waiter · 1 bill"). |
| Average rating | Average product rating and number of ratings. |
| Daily trend | Views, orders and revenue per day. |
| Traffic source | Where guests came from: Direct, QR, Campaign and the Wi-Fi login page. |
| Hourly activity | Menu opens by hour. |
| Language | The language guests opened the menu in. |
| Table breakdown | Views per table (when table QRs are used). |
| Best sellers | Product and quantity. |
Menu Engineering
For each item the table shows Views (detail opens), Orders, Conversion and Class & Advice. Classes follow the Kasavana-Smith method; the threshold is the median of views and orders. Above the table you see how many items fall in each class.
| Class | Meaning | Advice |
|---|---|---|
| ⭐ Stars | Many views, many orders. | Protect and highlight. |
| 🧩 Puzzles | Many views, few orders. | Review price, description and photo. |
| 🐎 Plowhorses | Low visibility, high sales. | Move it up the menu. |
| 🐕 Dogs | Low interest, low sales. | Consider removing it from the menu. |
Get AI advice on the Useroam AI · Menu Advisor card analyses your menu with this matrix and writes concrete, prioritised advice ("Useroam AI is analyzing your menu…"). With too little data: "Not enough view/order data for meaningful advice yet."; if unavailable: "Useroam AI is unavailable right now, please try again shortly." or "Connection problem, please try again."
Other sections
- Ordered Together (cross-sell / combo opportunity): Product A, Product B, Together (how many times), Opportunity (Combo menu or "goes well with" suggestion). With no data yet it fills up as guests order 2 or more products in one order.
- Product interest (detail opens): how often each product's detail was opened; items never opened are listed as Never viewed (consider promoting them or adding photos).
- Feedback & Suggestions: messages from the welcome page box (Date, From or Anonymous, Feedback); new ones have a new badge, cleared with Mark all as read. With none: "No feedback yet." The box is switched on and off in Menu Settings.

- Product dwell time: how long guests stayed on a product's detail (Opens, People, Average, Longest, Total, Measured). Items viewed long but ordered rarely attract interest but something is missing.
- Showcase performance: how long each item was visible in the list and how often its detail was opened (Views, Avg. look, Detail opens, Conversion, Assessment). Assessments: "Seen but not opened: review photo, title and price", "Average interest: a richer description may help", "Strong interest: keep it near the top of the menu".
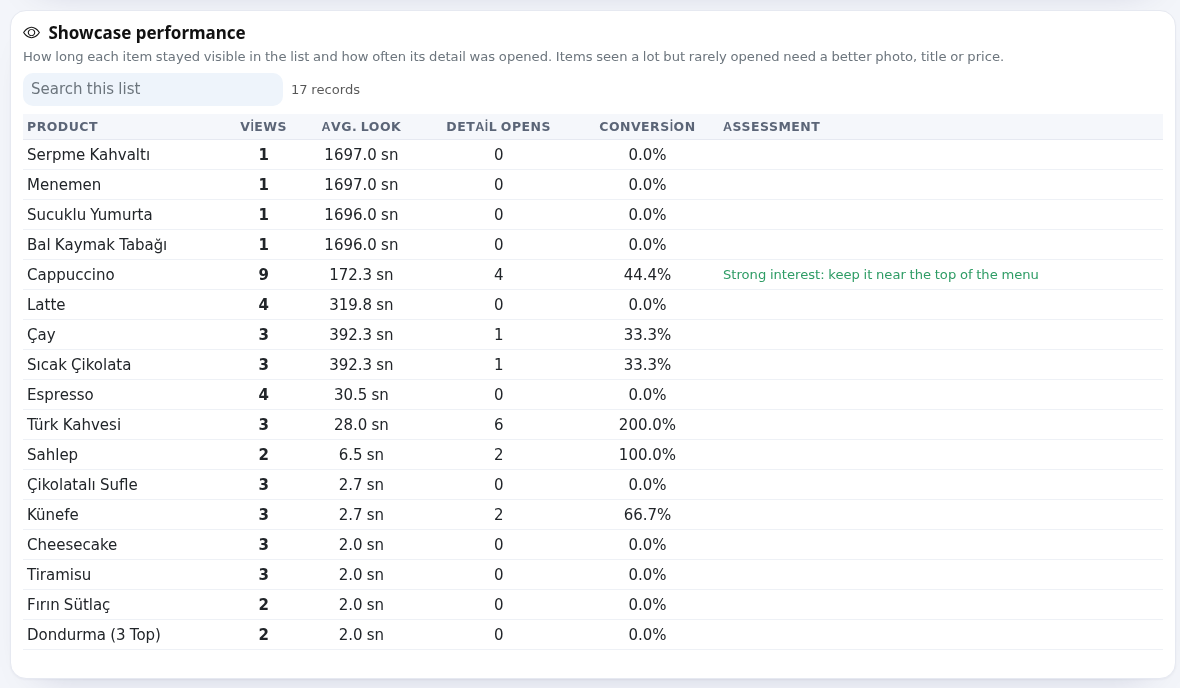
Search this list above the tables filters rows.
Other on-screen texts
The hints, counters, waiting and status texts below appear on screen as written (numbers and names are examples; "..." is replaced with your data).
- Last ... days
- Order count
- Revenue (TL)
- ... waiter · ... bill
- views × orders (last ... days)
- Kasavana-Smith menu engineering:
- Keep Stars · improve Puzzles · promote Plowhorses · review Dogs. Threshold = median views (...) & orders (...).
- Analyzes your menu with the Kasavana-Smith matrix and produces concrete, prioritized action recommendations: which product to highlight, which price to review, which item to remove from the menu.
- Products guests buy together in the same order: for combo menus or cross-selling. Recommendations get stronger as orders grow.
- Not enough co-order data yet. As guests order 2+ products in the same order, "most ordered together" suggestions will appear here automatically.
- Consider promoting, adding photos to, or reviewing products that never get viewed.
- Comes from the box on the welcome page. You can toggle it in menu settings.
- How long guests stayed after opening a product. Items viewed longest but rarely ordered may need a price or description review.
- No product detail opened yet. This fills up as guests tap products in the menu.
- How long each item stayed visible in the list and how often its detail was opened. Items seen a lot but rarely opened need a better photo, title or price.
- No visibility data yet. This table fills up as guests browse the menu.
- ... records
- No records match your search.
Frequently asked questions
Why are orders and revenue 0?
Table ordering is off, or guests use the general QR instead of table QRs. Turn on Accept orders from the QR in Menu Settings and stick table QRs on the tables.